Using a new generation of ice-penetrating data, researchers have redrawn the map of the Antarctic bedrock, exposing a rugged terrain that shapes how ice moves, melts and may raise sea levels in the decades ahead.
A secret landscape under two kilometres of ice
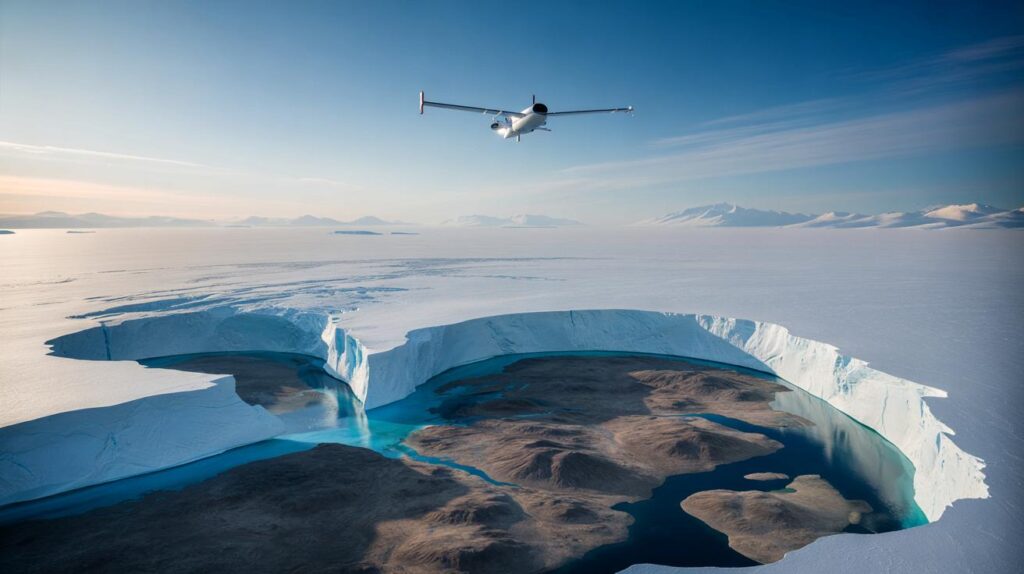
Antarctica looks flat and featureless from space, a smooth white shield spreading across the bottom of the globe. That view is deceptive. Beneath nearly two kilometres of ice, the continent is carved by mountains, rolling hills and canyons that rival Earth’s great river systems.
For years, scientists had only a blurry idea of what that subglacial landscape looked like. The new map, built from radar, satellite and seismic measurements, sharpens that view dramatically. It reveals roughly twice as many small hills and ridges as previous models, along with vast deep valleys that act like hidden highways for flowing ice.
The Antarctic bed is far rougher than scientists thought, with many more hills and a colossal valley capable of steering entire glaciers.
This level of detail matters because the shape of the ground beneath the ice controls how easily that ice can slide, crack and thin as the climate warms.
How scientists mapped a continent they can’t see
Creating the new map required a patchwork of measurements from aircraft, satellites and ground stations. Researchers used ice-penetrating radar mounted on planes to bounce radio waves off the bedrock. The time taken for the signal to return reveals the ice thickness and the shape of the land underneath.
They then merged these data with satellite measurements of ice flow speed and surface elevation, plus gravity and seismic surveys. A sophisticated computer model filled in the gaps between flight tracks and field sites, producing a continuous image of Antarctica’s hidden terrain.
From BedMachine to the latest generation
An earlier effort known as BedMachine had already surprised glaciologists by exposing some of the deepest canyons on Earth, including one beneath Denman Glacier that drops more than 3.5 kilometres below sea level. The fresh work builds on that foundation, with higher resolution and wider coverage.
- Radar flights provided direct measurements of ice thickness and bed shape.
- Satellites tracked how quickly ice is moving, hinting at where the bed is slippery or rough.
- Gravity and seismic data helped estimate bedrock depth in regions still lacking radar profiles.
By combining all these strands, the team produced a map that captures not just the grand canyons but also the smaller bumps and hollows that can slow, channel or destabilise ice sheets.
Twice as many hills, and what that means for ice flow
The standout result is the sheer number of subglacial hills. Many of these features are only tens to hundreds of metres high but stretch for kilometres. They act like speed bumps beneath the ice, anchoring glaciers and providing friction.
In areas where the bed turns from hilly to smooth, ice can suddenly accelerate. The new map reveals a patchwork of such transitions around key outlet glaciers, including in West Antarctica, a region already vulnerable to warming oceans.
Small changes in bed shape can mean the difference between a glacier that stays put and one that starts racing towards the sea.
The uncovered giant valley is even more striking. It runs beneath part of the ice sheet like an enormous trench, deep below sea level and open towards the coast. That geometry allows relatively warm ocean water to seep inland beneath floating ice shelves, eroding them from below.
A hidden gateway for ocean heat
Where the ice rests on bedrock below sea level and the ground slopes downward inland, glaciers are prone to what scientists call “marine ice sheet instability”. If the ice front retreats past a certain point, the retreat can continue on its own, no extra warming needed.
The newly mapped valley fits this risky configuration in several sectors. Once warm water gains access, it can thin the ice shelves that currently buttress the inland ice sheet. Lose those shelves, and the ice behind them can flow faster, raising sea levels globally.
| Feature | Why it matters |
|---|---|
| Subglacial hills | Increase friction, slowing ice and stabilising glaciers |
| Smooth troughs | Allow faster ice flow towards the ocean |
| Deep valleys below sea level | Provide pathways for warm seawater to reach the ice interior |
| Steep bed slopes | Can trigger rapid glacier retreat once a threshold is crossed |
Sea level stakes for coastal cities
The Antarctic ice sheet stores enough frozen water to raise global sea levels by almost 60 metres if it melted entirely. No one expects that scenario this century, but even a small percentage of that water reaching the oceans would reshape coastlines.
Accurate maps of the bedrock are central to predicting how much ice Antarctica will lose under different warming levels. Climate models now feed the new terrain into simulations of ice dynamics, testing how glaciers respond as air and ocean temperatures rise.
Early runs suggest that some areas might be a bit more stable than feared, thanks to newly identified ridges that pin the ice in place. Other regions, especially where the giant valley cuts inland, look more exposed than previous maps suggested.
For cities planning sea walls and flood defences, a few extra centimetres of sea-level rise can mean billions in extra costs.
That makes every improvement in Antarctic mapping directly relevant to long-term planning from London to New York, from Mumbai to Shanghai.
Why topography matters for climate predictions
The shape of the bed not only controls ice flow today but also how past ice sheets behaved. By combining the new map with sediment records and ancient shorelines, researchers can reconstruct previous warm periods, such as the last interglacial around 125,000 years ago.
Those reconstructions act as a stress test for modern climate models. If models can match past ice retreat patterns over this newly revealed landscape, their forecasts for the future gain credibility. If they fail, assumptions need revisiting.
Topography also affects how meltwater drains at the base of the ice. Water can pool in deep hollows, lubricating the interface and speeding up glacier movement. The new data show many more such hollows than expected, especially beneath thicker parts of East Antarctica that were once thought relatively quiet.
Key terms that help make sense of the map
A few technical phrases appear often in work like this, and they sit at the heart of the new findings:
- Basal sliding: the process by which ice sheets move over the ground, partly on a film or network of meltwater.
- Grounding line: the boundary where ice lifts off the bedrock and begins to float as an ice shelf.
- Ice shelf buttressing: the way floating shelves act like a brake, holding back the inland ice sheet.
- Marine-based ice: ice resting on bedrock below sea level, especially vulnerable to changes in ocean heat.
The updated bed map refines the position of many grounding lines and identifies where buttressing might fail first if ice shelves thin.
What comes next for Antarctic mapping
Even with this advance, large swathes of Antarctica remain sparsely measured. Future aircraft campaigns, autonomous drones and more sensitive satellites aim to close those gaps. Some teams are eyeing targeted drilling through the ice into key valleys to sample rock and water directly.
Each new dataset feeds back into the map, sharpening the picture of how Antarctica is built beneath the ice. The rougher, hillier and more dissected that landscape turns out to be, the more nuanced our understanding of how fast the ice sheet can change.
For now, the new map shows a continent that is anything but flat. Under the calm white surface lies a restless terrain of ridges and chasms, quietly steering the future of global sea levels from two kilometres below the ice.