Monday morning, 7:42 a.m., drizzle on the windshield and the fuel light already glowing orange. You pull into the first gas station on the way, half awake, half anxious about the bill that’s about to hit. You watch the numbers scroll on the pump, faster than you’d like, without really knowing what you’re paying for beyond “diesel” or “unleaded”. Price per liter, total amount, vague line about taxes… then you drive off, resigned, telling yourself “that’s just how it is now”.
From February 12, that quiet little ritual is going to change. Not the drizzle. Not the early-morning stress.
What’s going to change is what you’ll see. And what you’ll finally understand.
From February 12, a new line appears on the pump
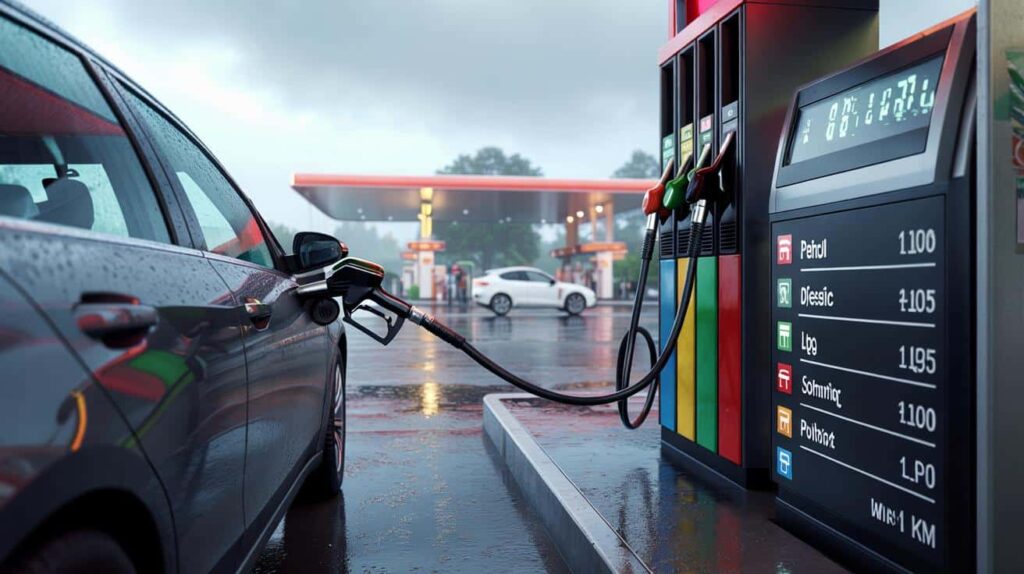
From February 12, gas stations will have to display a new piece of mandatory information, directly at the pump: the comparison between the price per liter of fuel and the price of other energies for the same distance traveled. In concrete terms, right next to the euros and cents you already know too well, you’ll see how your fill-up compares to an electric charge, LPG, or sometimes even public transport on an equivalent route.
This is not a gadget. It’s a new transparency rule that quietly reshuffles the cards for drivers standing in front of the pump, bank card in hand.
Picture a big suburban station on a Friday evening. A driver fills up with SP95-E10, eyes on the digits racing: 1.87 €/L, then 35 €, 40 €, 60 €. Until now, the only reflex was “last week, it was cheaper” or “this station is more expensive than the one near the supermarket”. From February 12, a small extra panel will appear on the pump: a simple, clear comparison between 100 km in petrol, 100 km in diesel, 100 km in electric.
For the same distance, you’ll finally see who’s really the most expensive… and by how much. Suddenly, the question changes: it’s no longer “is this station expensive?” but “is this energy still the right one for me?”
This new display obligation did not fall from the sky. Public authorities have been under pressure for months from consumer groups asking for more transparency on energy costs. Regulated tariffs for electricity, tax debates on fuels, encouragements to switch vehicles: everything pointed to one blind spot. At the pump, drivers had numbers, but no context.
By forcing stations to show a cross-energy comparison in plain language, the rule gives back a form of power to the person who pays. *When you can finally compare, you can finally choose with your eyes open.*
How to read this new information without getting lost
The good news: you won’t need a calculator or a master’s in energy economics to use this new display. The law explicitly requires a clear, understandable format, usually with the same basic principle: cost per 100 km for each type of energy. You’ll see, for example, a small table or board indicating something like “100 km in petrol ≈ X € / 100 km in diesel ≈ Y € / 100 km in electric ≈ Z €”.
So while the liter counter keeps spinning, another figure will quietly tell you how much this choice really costs on the road.
A practical way to use it: fix in your mind the number shown for your fuel, then look at the others. If 100 km in your petrol car is shown at 11 €, and electric is at 5 €, that gap is suddenly no longer abstract. You may not change vehicle overnight, of course. Let’s be honest: nobody really does this every single day.
Yet next time you consider buying or changing cars, those numbers will come back. And in the meantime, you can already compare between stations and between your own journeys, month after month, with a different eye.
There will be misunderstandings, that’s almost guaranteed. Some drivers will think the cheapest line is “recommended”, others will panic at the difference without taking their own situation into account. That’s where a bit of perspective helps.
“People arrive at the pump tired, stressed and often in a hurry. If you give them one clear, concrete number that speaks to their wallet, they’ll remember it. That can change habits far more than yet another political speech,” explains a station manager in the outskirts of Lyon who has already prepared the new display.
To avoid getting lost, keep three simple questions in mind when you read the panel:
- What does 100 km really cost me today with my current fuel?
- How big is the gap with the other energies on the board?
- Does this confirm or challenge what I believed about my car’s running costs?
More than a panel: a small daily revolution
This new mandatory information is not just a bureaucratic tweak. It quietly pushes fuel out of the vague, emotional zone of “too expensive” and into a more concrete logic: price per distance, comparable to anything else. The same way we got used to the energy labels on fridges or washing machines, we’re now entering the age of energy labels… at the pump.
You’ll still sigh when you see the bill, that won’t magically vanish. But you’ll know whether it’s your car, your energy type, or simply the global context hitting your wallet.
There’s also a collective dimension hidden in this small panel. When thousands of drivers, every single day, are confronted with the real long-term cost of their fuel, conversations change. At home, at work, on social media. “Wait, did you see that 100 km in electric is half the price?” or on the contrary “I thought diesel was dead, but look at that board.”
We’ve all been there, that moment when you realize you’ve been driving for years without ever really questioning the cost per kilometer. This new display will not solve everything, but it gently forces that question into the open.
Some will see it as a hidden nudge toward electric cars. Others will use it as ammunition in the ongoing debate about taxes on fuels. Between those two extremes, there is the everyday driver, who simply wants to understand before paying.
The plain truth is: **transparency calms distrust**. When the figures are there, right in front of your eyes, on the same board for everyone, discussions become a bit more factual, a bit less fueled by anger alone.
And maybe, on a gray Monday morning, that’s already something.
| Key point | Detail | Value for the reader |
|---|---|---|
| New mandatory display | From February 12, pumps must show a comparison of the cost per 100 km between fuels and other energies | Lets you see in one glance if your fuel is still financially coherent |
| Simple format | Practical board or table, with equivalent distance costs instead of just price per liter | Makes complex energy data understandable without calculations |
| Everyday impact | Changes how you think about your car, your next vehicle, and your monthly budget | Helps you anticipate, compare, and eventually save money over time |
FAQ:
- Question 1Is this new display really compulsory for all gas stations from February 12?Yes, the rule applies to stations above a certain size threshold, which covers the vast majority of roadside and supermarket pumps used by everyday drivers.
- Question 2Will this change the price per liter I pay?No, the liter price stays the same. The new panel only adds context by converting that price into a cost per 100 km and comparing it with other energies.
- Question 3Can stations “massage” the figures to make one energy look better?They have to follow a standardized calculation method based on official data and average consumption, which limits creative accounting or marketing tricks.
- Question 4What if my real consumption is higher than the example on the board?The numbers on the panel are averages to compare energies. If you drive mostly in the city, loaded or at high speed, your real cost may differ, but the gap between energies stays meaningful.
- Question 5Does this mean I should switch to an electric car right away?Not automatically. The panel gives a financial snapshot for energy use, but your choice also depends on your mileage, charging possibilities, budget, and personal needs.